Psychrometric chart.
Psychometric chart.
Graphical representation of psychometric properties is called psychometric chart.
In this chart dry bulb temperature lies on x-axis (abscissa). And specific humidity lies on y-axis (ordinate).
1. Dry bulb temperature line.
In psychometric chart dry bulb temperature lines draws vertical and parallel to ordinate at definite distance. Each lines draw in periods of 5 degree celcious. Generally dry bulb temperature shows -6 degree celcious to 45 degree celcious.
2. Specific humidity lines.
In psychometric chart specific humidity lines draws as horizontal lines and parallel to abscissa at definite distance. Generally in psychometric chart specific humidity lies between 0 to 30 gram per KG. Specific humidity lines are also called moisture content line.
3. Dew point temperature lines.
In psychometric chart dew point temperature lines draws as parallel to abscissa distance between two D.P.T. lines are not same.
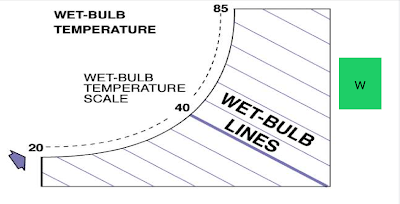
4. Wet bulb temperature lines.
In psychometric chart wet bulb temperature lines draw as inclined straight lines at unequal distance.
At saturation curve the value of dry bulb temperature and wet bulb temperature are same.
5. Enthalpy lines.
In psychometric chart enthalpy lines draws as inclined straight lines at equal distance.
6. Specific volume lines.
Specific humidity lines draw as straight inclined lines at unequal distance.
7. Relative humidity lines.
Relative humidity lines draw as curve on psychometric chart. Generally in psychometric chart shows value 10% ,15%, 20% to 100%.
8. Vapour pressure lines.
Vapour lines are straight and horizontal lines at equal distance. These line don't draw at psychometric chart. But in the left side of chart there is a scale which shows vapour pressure.


Comments
Post a Comment